Or, simply put, does training work, and what does success look like?
As Christmas approaches, we begin to turn our attention to our annual new year’s resolutions. Many of us consider taking up exercise to get fitter and healthier for 2018 after the Christmas and other over indulgences. However, by mid-January reality begins to kick in. We start with good intentions, but soon become disillusioned by lack of tangible progress, or over-train to the point of exhaustion or injury.
So, you think, okay this time I will exercise according to a plan, excited by the abundance of ‘free’ cycle training plans that you find for example on the Internet, each proclaiming “fitness in 30 days”. However attractive these plans are, they are of little value to the average person, unless your goals, fitness and time availability exactly match the plan, you are likely to be over or under-trained. It is unlikely that you will train specifically for your goals, assuming you have thought through what you want to achieve beyond “I want to be fitter, healthier and slimmer”. In these circumstances, it is difficult to have the self-determination to keep motivated. We’ve all been there.
One reason that most of these plans fail is that they do not take into consideration your age, level of current fitness, what motivates you or that you might be just at the starting point with your cycling, and not sure of how long and how far to go; what to wear, how to avoid common pitfalls, etc.
So, let’s explore what we need to consider to get the best of every workout session, maximizing our precious free time – after all, exercise is tough, so it makes sense to get the maximum benefit from it.
There are three primary ways to measure our training effort:
- Rate of Perceived Effort (RPE). This is the simplest form and is what www.cycleforfitness.com uses for our beginner plans, or those people who have yet to invest in a heart rate monitor. The RPE plans are based on 10 levels:
- (1 to 2) active recovery/easy endurance (we can hold a conversation and ride without getting out of breath),
- (3 to 4) aerobic endurance (we can talk with some breaths in between sentences, and could keep this pace for the entire workout)
- (5 to 6), harder tempo (we can speak, but need to take breaths in-between, but could not hold this pace for the entire workout)
- (7 to 8), development speed (able to speak one word at a time between breathing)
- (9 to 10), maximal effort and climbing (don’t even think of speaking to me).
- Heart Rate Zones (HR Zones). As we move towards more advanced training, we need to establish our heart rate threshold (you need a heart rate monitor and our heart rate calculator) and use this to create heart rate zones. As you become fitter you will be able to stay closer to your maximum heart rate for longer, enabling you to train harder to get better results.
- Power Zones. Similar in concept to HR Zones, power zones are more sophisticated, require a power meter and need to be based on a threshold called “Functional Threshold Power” (FTP). This can be estimated by riding as hard as you can for 20 minutes. A value of 95% of the average power over the 20 minutes is used to give you your baseline FTP, which will then define your power zones. As you get fitter your FTP will increase and hence you power zones will change over time allowing you to monitor and train according to your threshold.
So how do our plans work? We look at three indicators when creating the workouts:
- Training Stress Score (TSS) – a measure of the hardness of your workout. We increase the TSS progressively to ensure your work rate increases over time.
- Chronic Training Level (CTL) – this indicates your level of fitness. We aim to increase this progressively with each workout, using the training sweet-spot we discussed above.
- The Acute Training Level (ATL) – indicates your level of fatigue and is used to determine how much recovery time you need between sessions. We calculate the expected, however the actual ATL will require you to use a heart rate monitor, and power meter for accurate measurements.
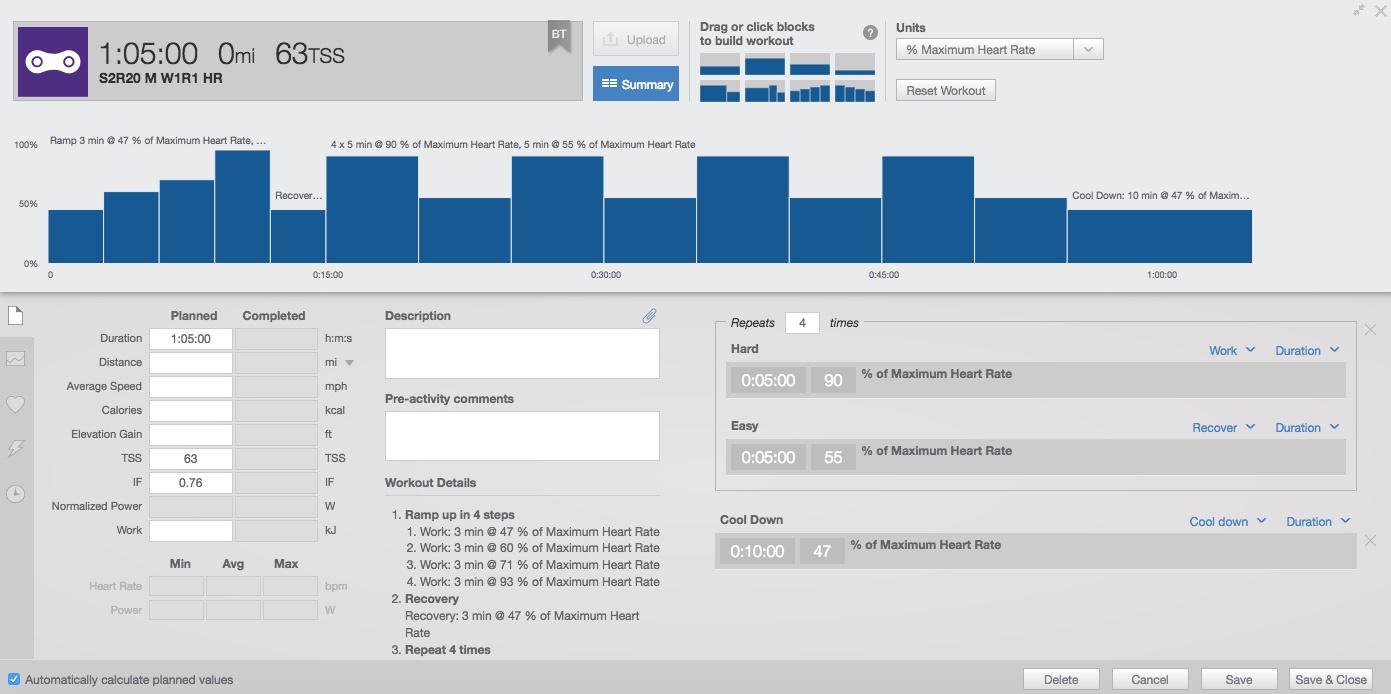 By putting these together, if you are using a heart rate monitor (and preferably power meter) we can calculate your expected performance at any given time. This is known as the Training Stress Balance (TSB), simply calculated as your fitness (CTL) minus your fatigue (ATL). This indicates your ability to perform or simply called your “form” (you hear this a lot when pundits talk about athletes or racehorses). Here’s an example of one of our heart rate based workouts.
Each time you train your fitness (CTL) increases, however your level of fatigue (ATL) also increases, generally at a faster rate. It’s okay over a short period, but does mean your form (TSB) is decreasing. The good news is that when we rest between sessions the fatigue drops away faster than fitness, meaning our ‘form’ improves. Therefore, athletes training for an event, will look to “come into form” or “peak” at just the right time i.e. greatest possible form on the day of the event.
By follow our training principle, we can plan and show your progression. I like to call this the beautiful curve, and as an example my curve is shown below.
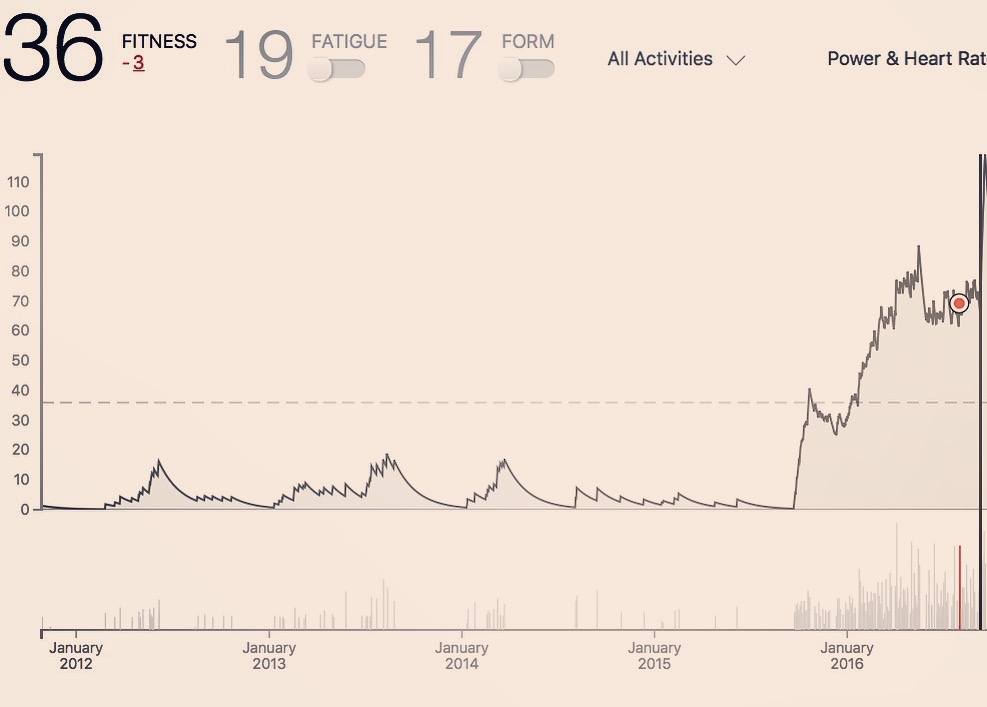 What is interesting is that although I had been riding for several years, and had some peaks in performance each summer, it wasn’t until I started working using this strategy that it really made a difference, and you can see this very clearly.
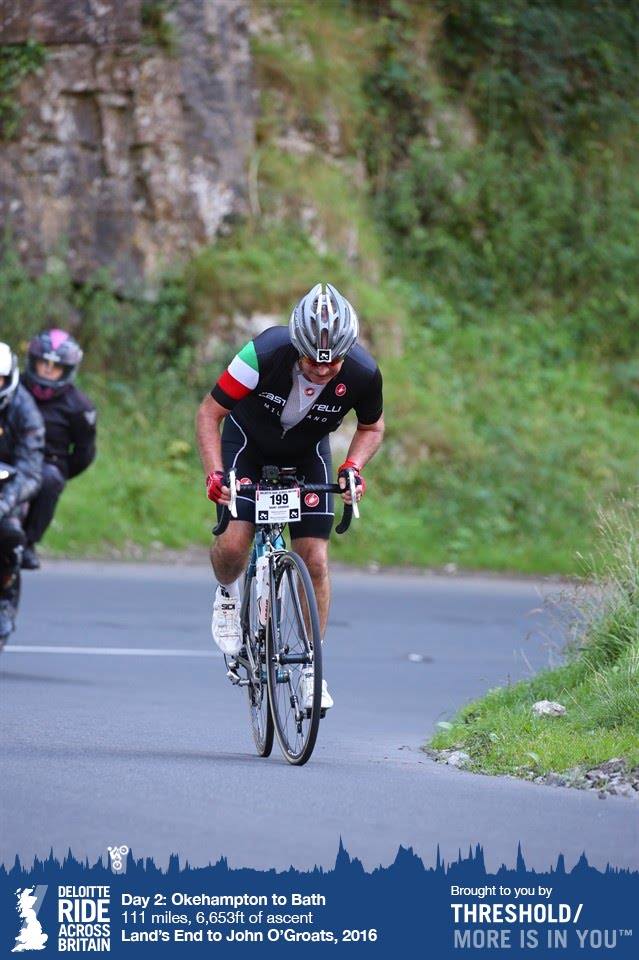
The first surge was to help me ride 500Km around Mallorca, the next surge made me fit enough to ride and enjoy the Ride Across Britain (969 miles in 9 days). All I can say is that from personal experience, it works!
So, if you have been struggling to become fitter or want to start out using a proven technique, where every training session will have a positive and sustainable impact, get in touch, select one of our packages or pick up the phone (07525765883) and we can discuss how we can help you start your journey to fitness and well-being.
You bring the resolve, we bring the results..